
It is hard to believe that we are two weeks away from the end of the 1st quarter. Spring is here after a relatively mild winter, so we have nothing to complain about! Can we complain about the residential real estate market? Yes and no. For sure it has been slower than we’re used to, but we are in ramp-up mode. From now until the middle of June are the most active months for real estate transactions, so we are committed to being positive that the trend is our friend.
www.urbandigs.com
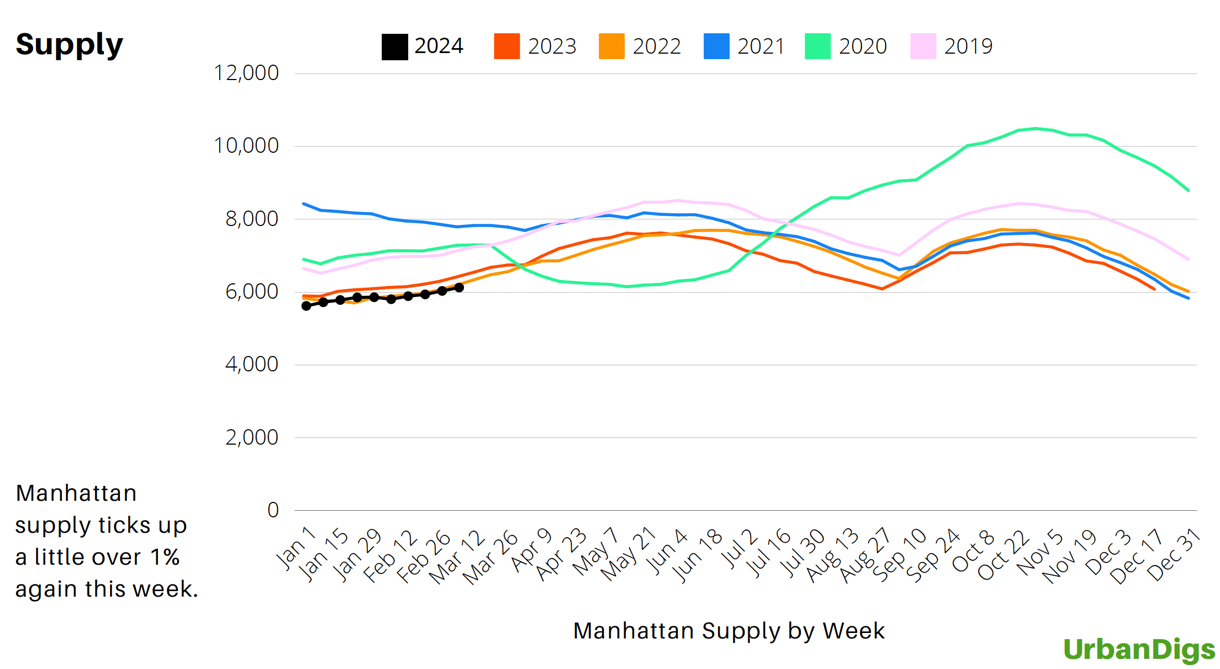
The Manhattan market is undergoing notable shifts as we progress into the spring season. With approximately 6,132 homes trying to sell, there is a sense of constrained supply compared to the past two years, where listings averaged between 7,500 to 7,600 homes. This decrease in available inventory could be attributed to various factors, including economic uncertainties (rates), shifts in buyer preferences, and ongoing global events. However, we are at the beginning of the busiest four months, so we are going to be watching this very closely and bringing the data to you as we go through it.
www.urbandigs.com
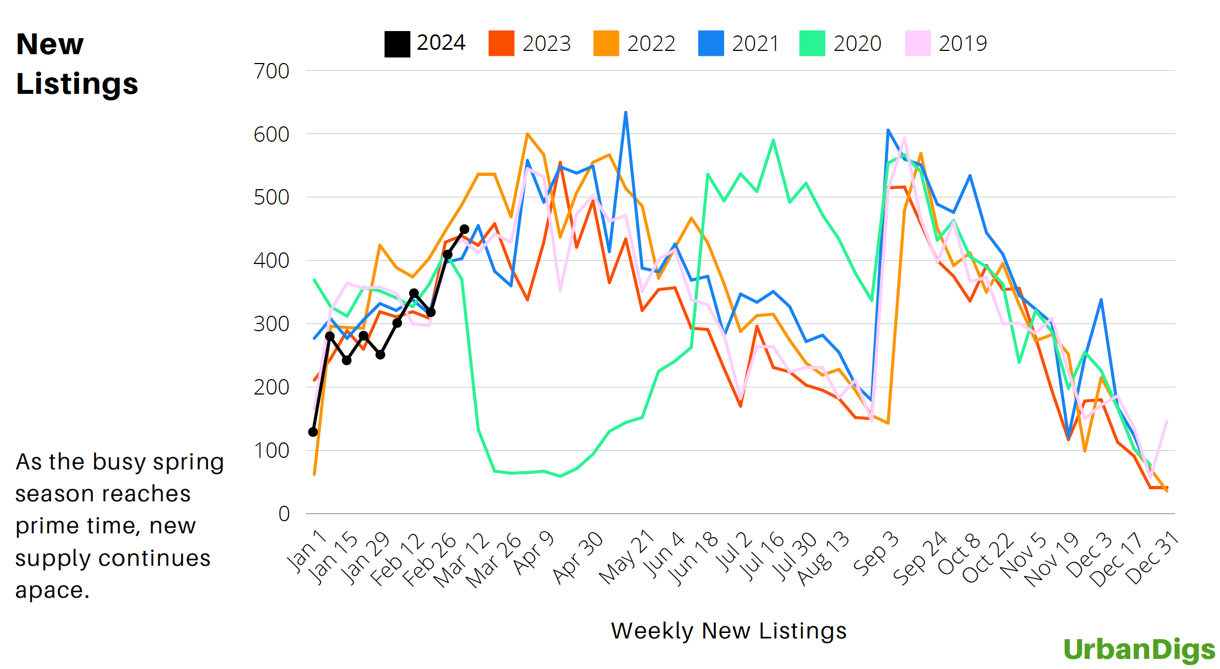
A positive trend is beginning to bloom in Manhattan’s weekly new listings. As of this writing, the numbers mirror the trends observed over the past two years, which indicates a consistent pattern in the city’s housing market. Despite fluctuations in market conditions, the city’s real estate sector remains resilient. The steady influx of listings underscores Manhattan’s status as a premier destination for folks seeking upscale urban living, with offerings that cater to diverse preferences and lifestyles, sustaining the city’s position as a global real estate hub. There is no place like New York City.
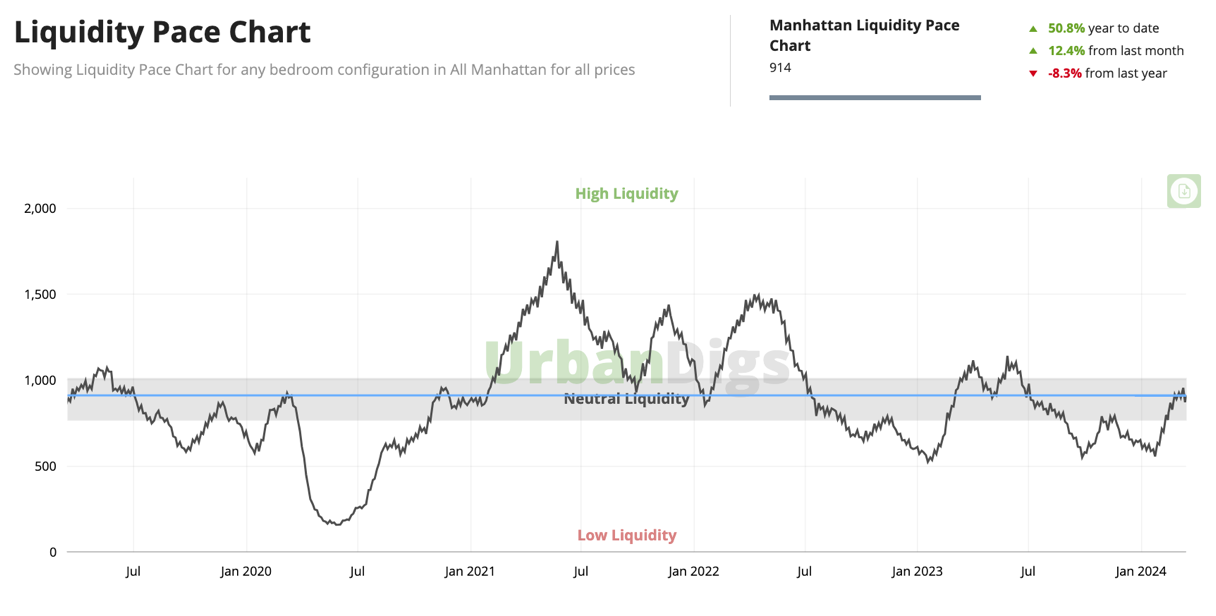
The chart illustrates the fluctuation in Manhattan’s market activity over time, using a 30-day moving window of contract activity, where low activity suggests a slow market, aiding in identifying the best times for sellers to list properties or for buyers to submit offers.
www.urbandigs.com
We talked about supply being on trend with the last couple of years and new listings continuing to tick higher. Supply is clearly doing its job. So, what are the buyers doing? They are taking their time to consider their options. The chart above shows us that we are off the lows in terms of buyer demand but where we go from here will need to be analyzed with more data. It will be interesting to see where we end up at the close of the first quarter. We believe buyers are getting used to the interest rates and if they’re not paying cash, the buyers know that the possibility of refinancing at a lower rate is closer than it was last year.
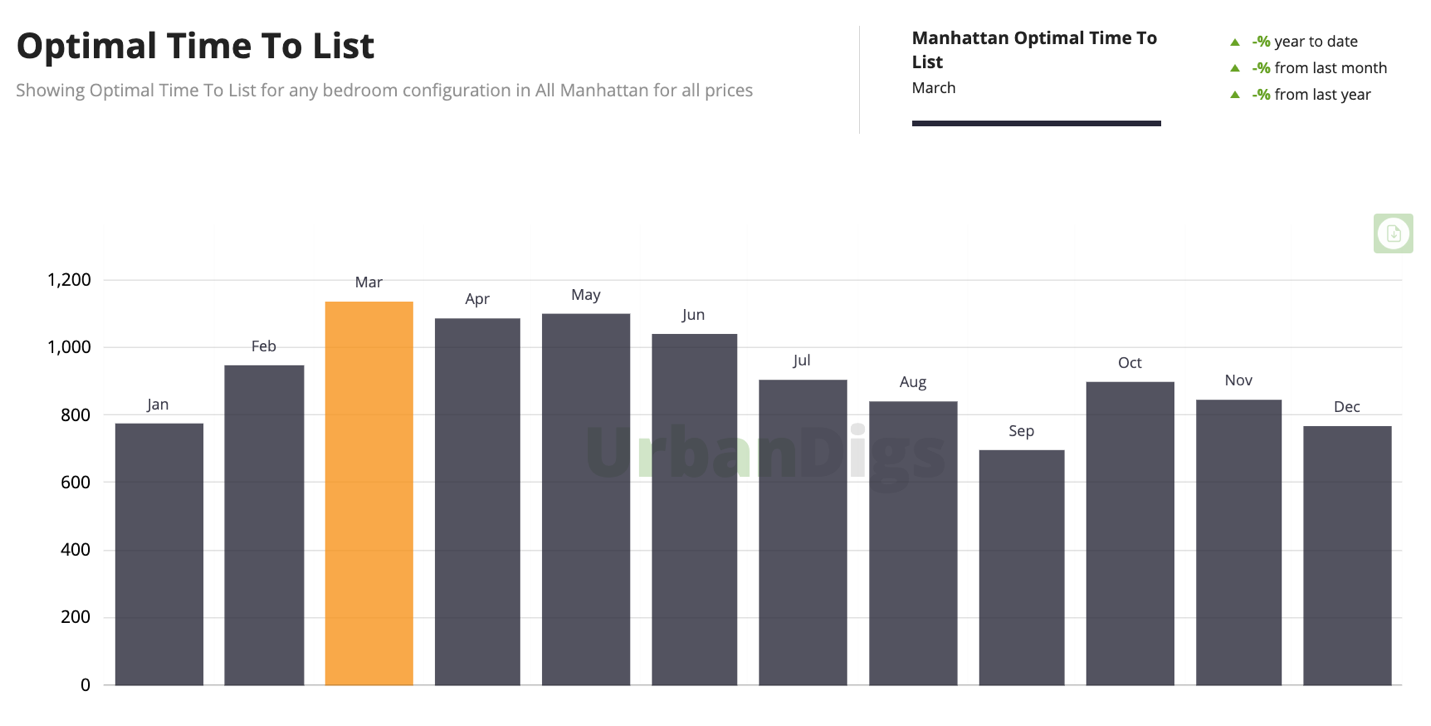
The chart shows how many contracts are signed historically for each month of the calendar year, revealing the seasonality of the markets. The months with the highest deal volume drive buyer competition and are optimal times to list properties for sale.
www.urbandigs.com
For sellers who are still on the fence about hitting the market, this chart is for you! The optimal time to list an apartment in Manhattan typically aligns with now, the spring season, specifically between March and June. During this period, there tends to be an increase in buyer activity, driven by factors such as improved weather conditions, tax return season, and families looking to move before the start of the new school year. Additionally, sellers may benefit from showcasing their properties when the city’s landscape is vibrant, with parks and outdoor spaces in full bloom, enhancing the appeal of their listings.
As always, please reach out with any questions.