
If you follow the New York City real estate market, it is clear to see the shift that is most certainly upon us. With six months of 2022 behind us, the question becomes, what’s ahead of us.
In order to answer this question, it is important to understand that over the last few years, the New York City market has functioned on a different metric than the rest of the country. Nationally, over the course of 24 months, the price of a home in the US went up 37%. The speed and size of that increase is both incredible and historic! What happened as a result? Wild bidding wars and a severe lack of inventory across the country. Only recently has the leverage between buyers and sellers begun to move toward some semblance of balance.
In New York City, this just was not our experience.
As we talk about Manhattan over the past 3 years, keep in mind:
- 2019 – this was the most recent “traditional” market, showing the seasonal trends that we would expect
- 2020 – due to the pandemic and the related quarantine, this was a very atypical year
- 2021 – Pent-up demand caused a supercharged year that carried into early 2022 and ignored many “traditional” seasonal trends
- At no point did New York City experience the huge price increases experienced in many other US markets.
Taking a look at the current Manhattan supply in the chart below, we can see that the number of apartments on the market has leveled off after a gradual climb. As we wait for a trend to emerge, it is quite possible that we will continue to follow 2019’s seasonal curve with a bump up coming after the summer.
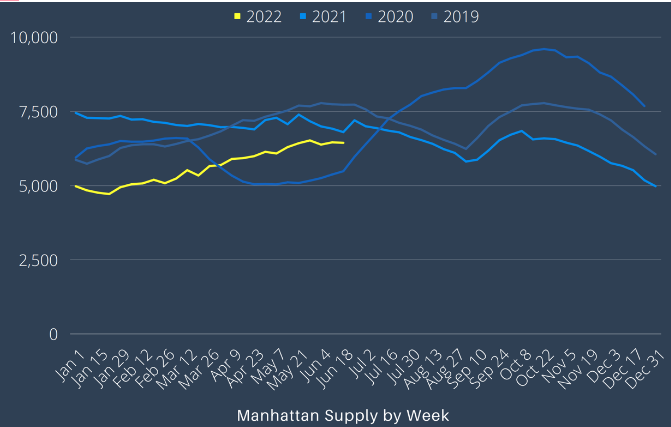
DATA COURTESY OF URBANDIGS.COM
With new listings coming to the market, you can see in the chart below how closely we are following the 2019 and 2021 curves. Blame it on summer vacation, but historically July and August tend to be slower months here in NYC.
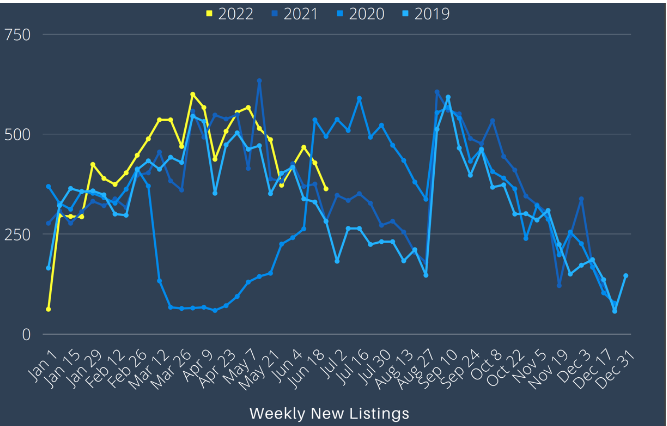
DATA COURTESY OF URBANDIGS.COM
What to focus on? Contracts Signed – this is where the rubber meets the road in terms of what is getting sold.
The chart below demonstrates how we were following the 2021 high through the first quarter of this year. A shift began as interest rates began to rise. In addition, other financial and global factors contributed to the market adjustment.
Notice below how close we are to the 2019 curve.
No one has a crystal ball and traditional trends give us only a look at what has happened in the past, not necessarily what will happen going forward. Saying that though and looking at where the numbers are traveling, there is a possibility that this shift in the market could start looking very familiar to what we were experiencing pre-pandemic in 2019.
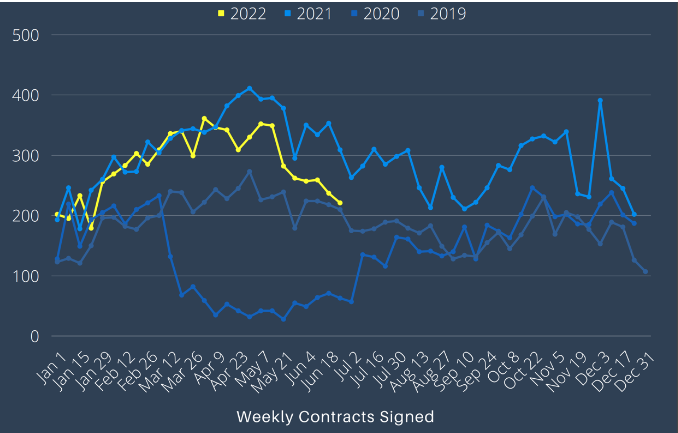
DATA COURTESY OF URBANDIGS.COM
Thinking of renting and waiting to see where things land in the market?
You’ll find the popularity of New York City has not waned. Rents are up and continue to rise as we write this newsletter. There are not a ton of choices for tenants. Let’s go to the next chart below.
The number of new listings is neck-and neck with new leases signed. Until these number start to get some separation from each other, you can expect the high prices to continue.
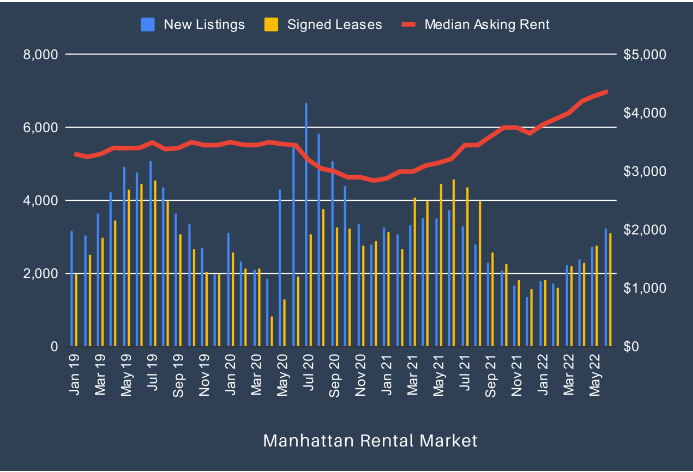
DATA COURTESY OF URBANDIGS.COM
We will have the first half of 2022 data to share with you in our next newsletter.
As always, please email or call with any questions. We would be happy to have a deeper discussion if real estate is on your mind. Feel free to contact us anytime!
Wishing everyone a wonderful 4th of July holiday weekend!