We are officially in the fall market. Let’s review three important points: (1) what did Q3 tell us; (2) where are we now; and (3) how do rates play into this?
POINT ONE – Third Quarter Market Report – What is Notable?
- Median and Average prices rose annually but fell quarterly.
- Time on market rose 64% since Q2
- The Sales to List ratio (the closing sale price vs where the unit was listed) has stayed virtually the same since last quarter but has potentially peeked.
www.urbandigs.com
Are we entering a buyer’s market? Hard to say today. If supply remains within seasonal expectations, buyers will continue to have limited choices. It’s important to note that turnkey apartments are catching the bid quickly. Units that need work are taking longer to sell.
Look at the full report here: kw-report-Q3-2022
POINT TWO – Autumn Still Looks Seasonal:
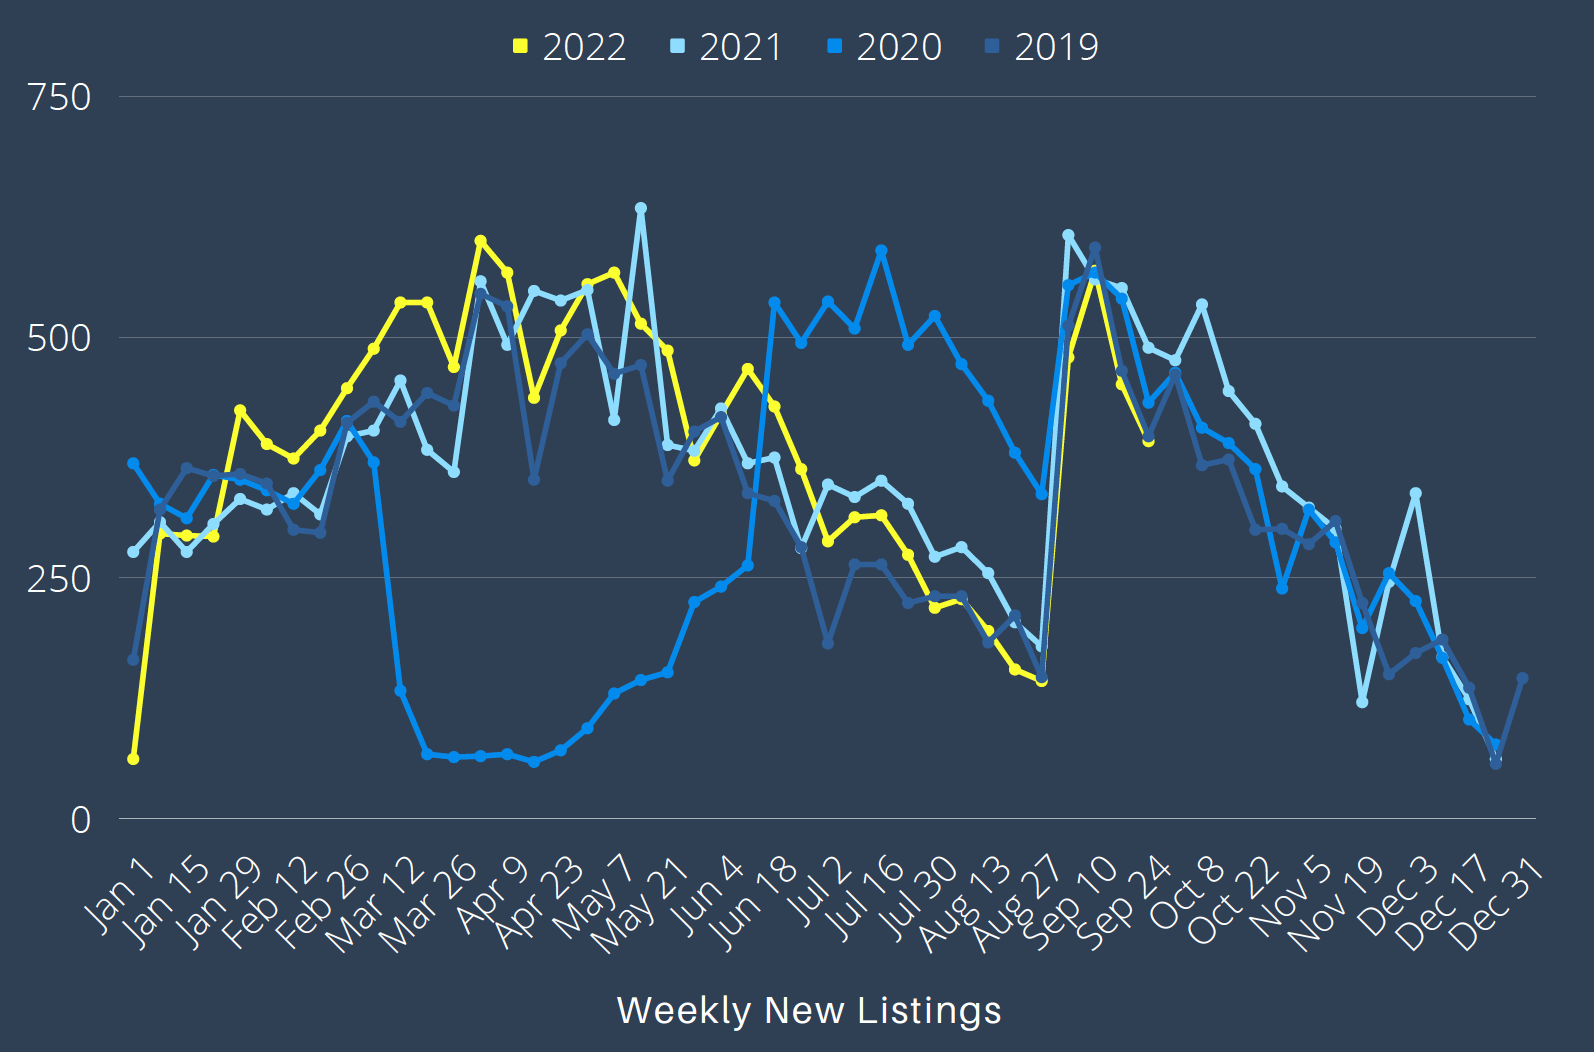
Looking at new listings coming on the market, levels are currently lower than they were the last three years. This tells us two things: First, sellers are not being forced onto the market in fear or distress. Second, this should contain supply and keep a check on inventory.
www.urbandigs.com
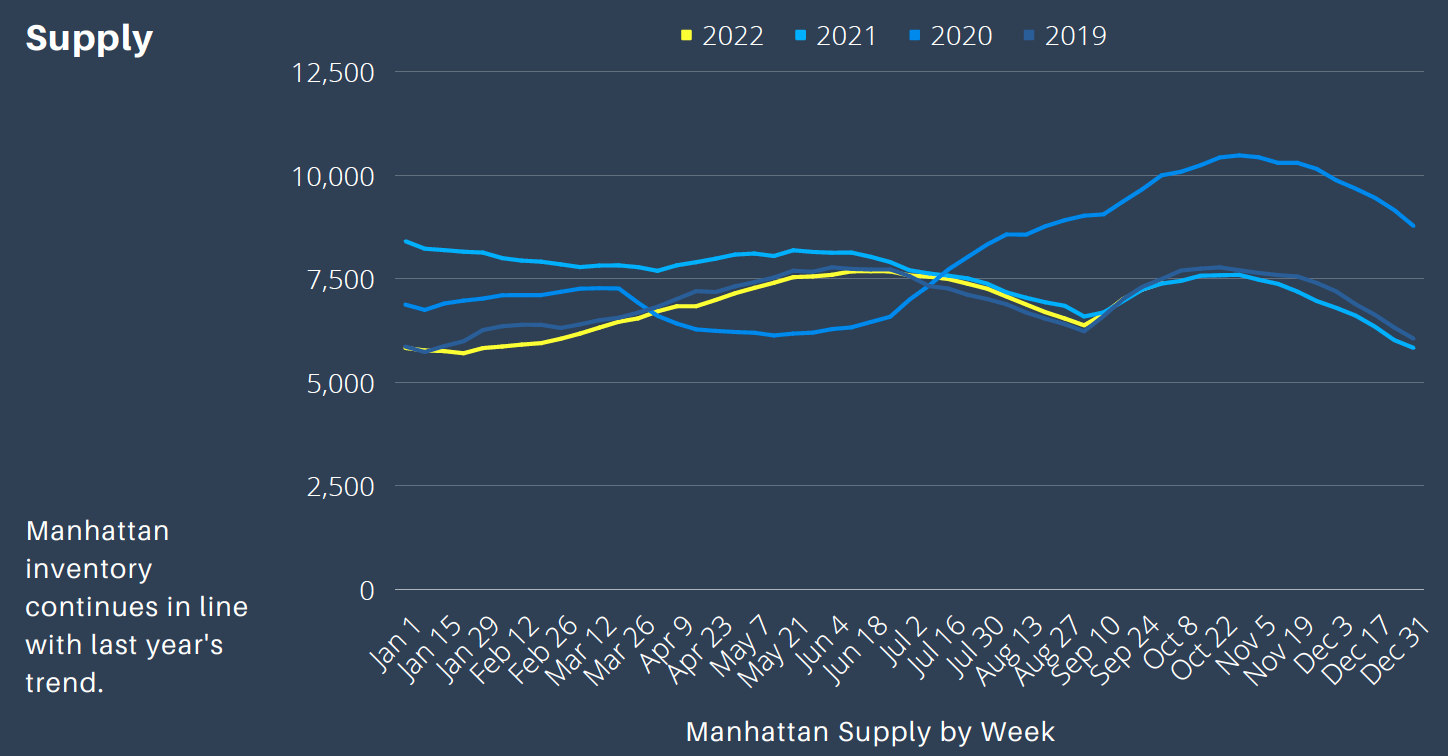
With supply up 2.1% from last week, the number of apartments on the market is directly in line with where we were in 2021. We expect this to continue to rise with seasonal shifts. Though demand (pending sales) is still dropping, we are still above 2019 and 2020 levels.
www.urbandigs.com
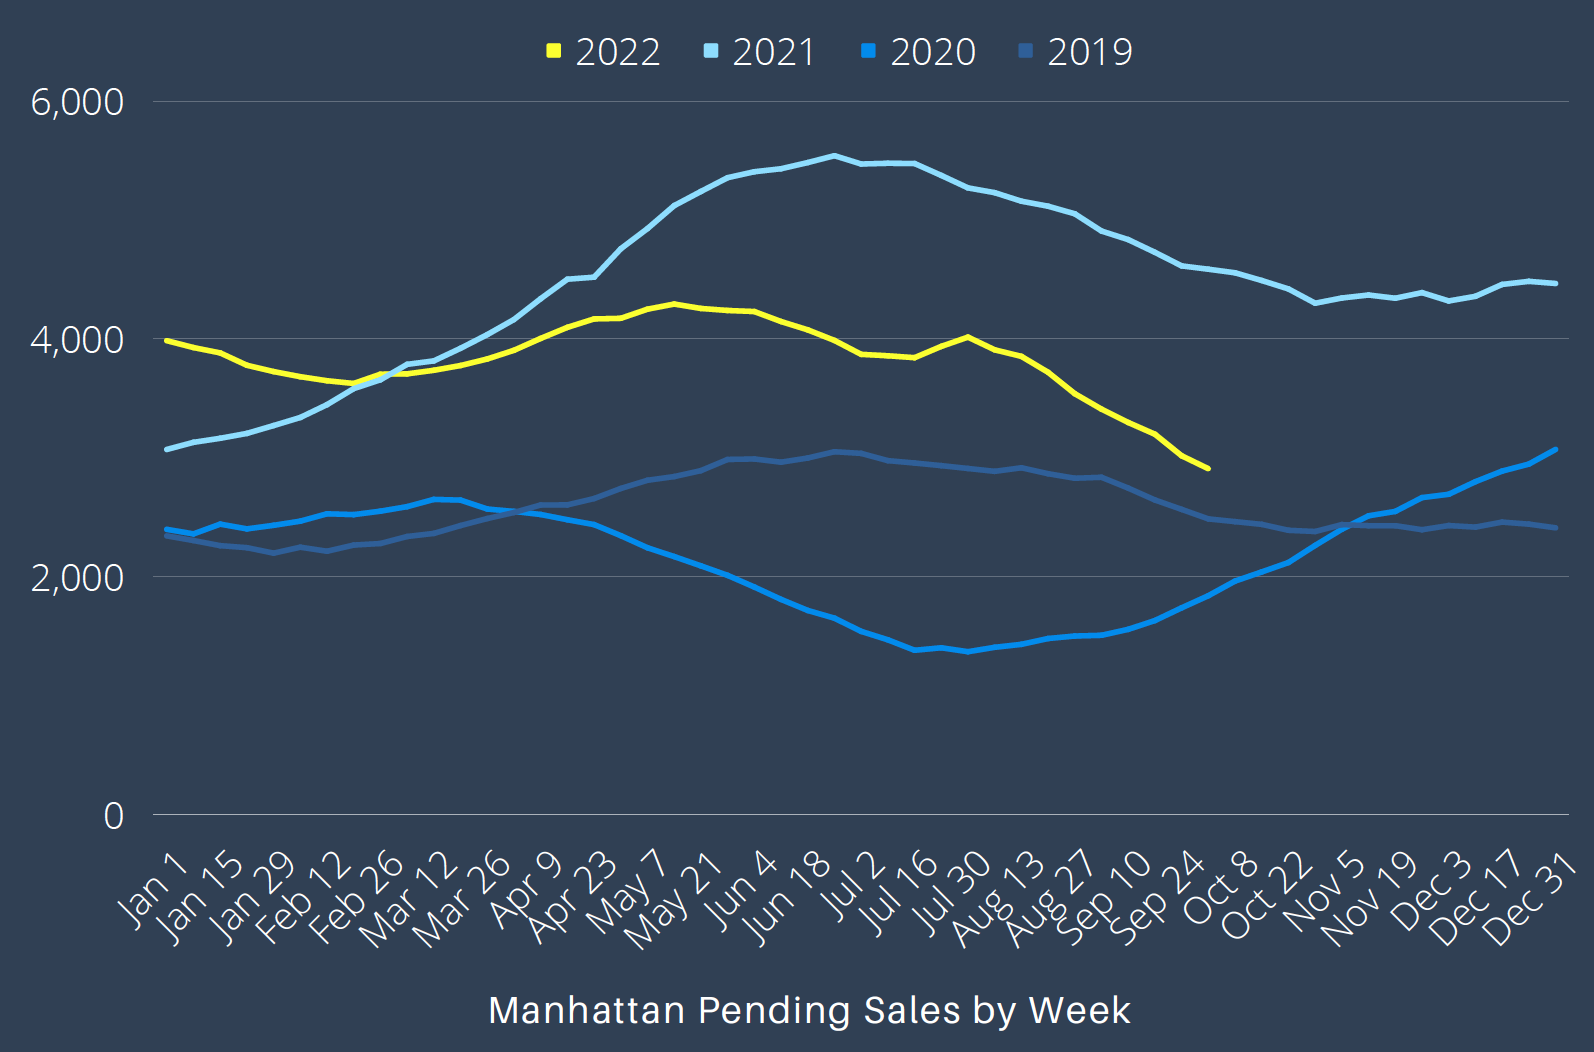
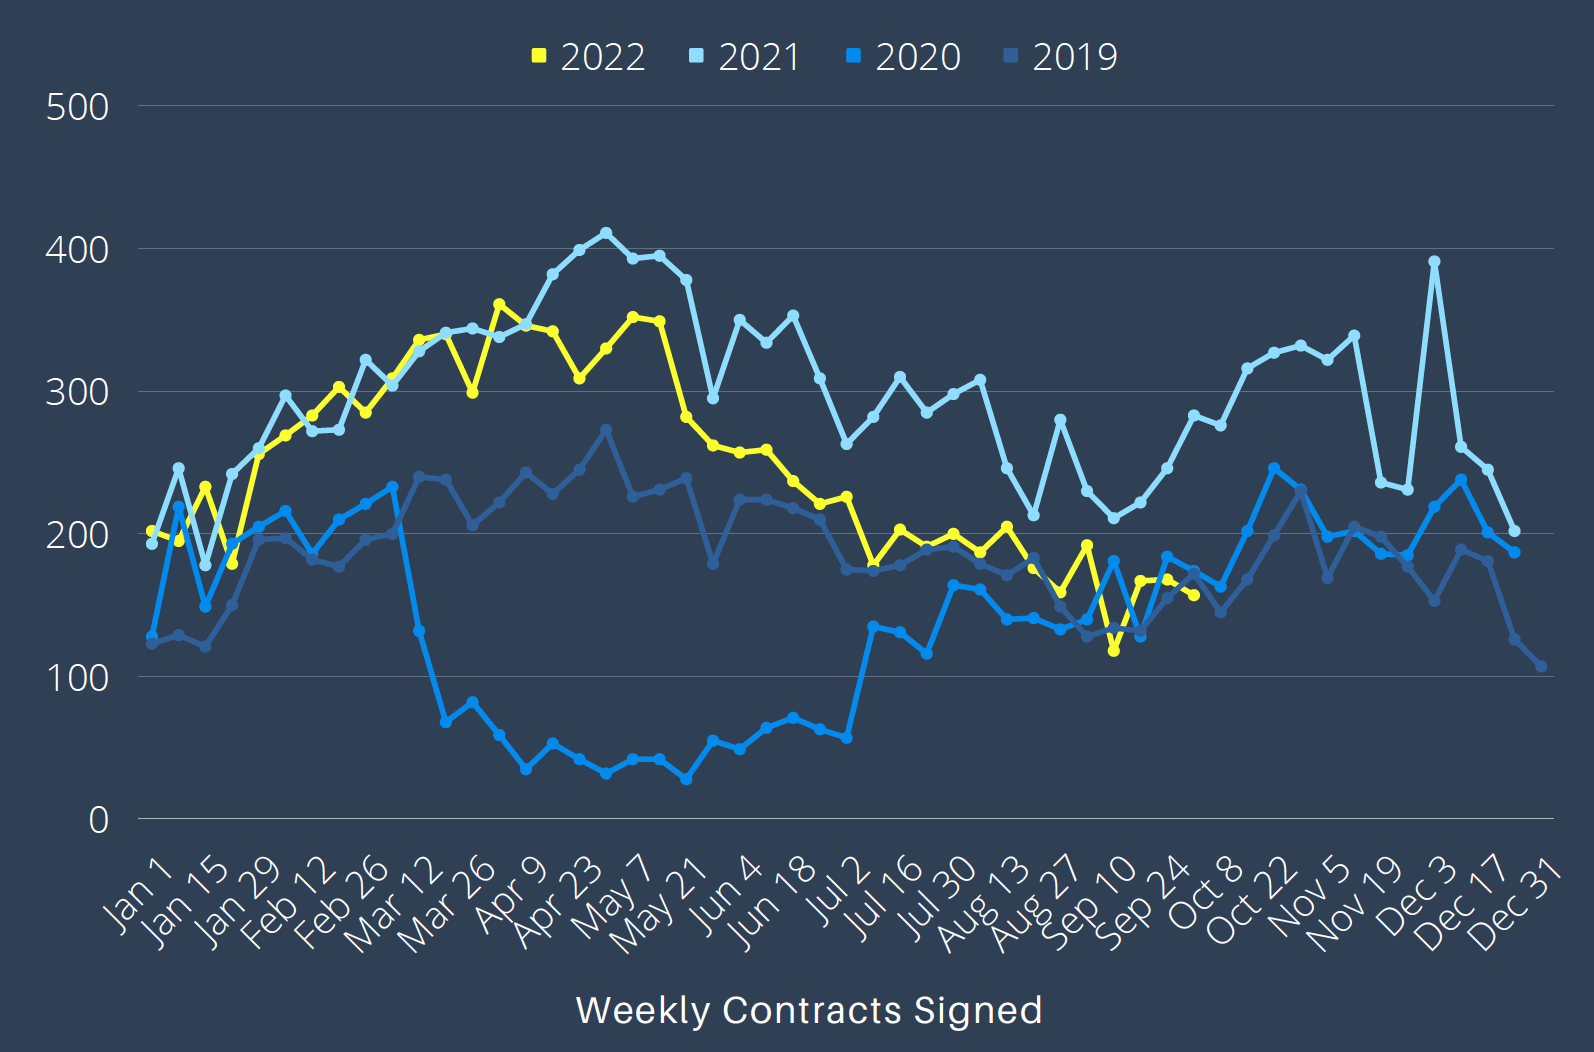
Contracts signed is down 6% but contrary to how it might feel, with 706 units currently in contract, we are still at historic norms. Now saying that, seasonally we do expect to see a pop in activity by the end of October. If contracts signed doesn’t make it to 850 by the end of the month and things instead continue to trend down, then that would change that conversation. We will be keeping a close eye here.
www.urbandigs.com
POINT THREE – Mortgage Rates:
It’s important to talk about what’s going on with rates. Mortgage rates hit 52-week highs 19 times in 2022. Mortgage rates are in the mid-6% range now vs high 2s a year ago. Everyone is experiencing this, and everyone is wondering when does this end?
Where is the Fed Funds Rate going?
Good question. The answer? It’s all about the fed funds futures and their terminal rate. Look at the chart below. For clarification, the terminal rate is where the market expects the fed funds rate hikes to end. That’s the where and the when? How high does it go and when is that going to happen? The chart below is a very good illustration of the market’s expectation.
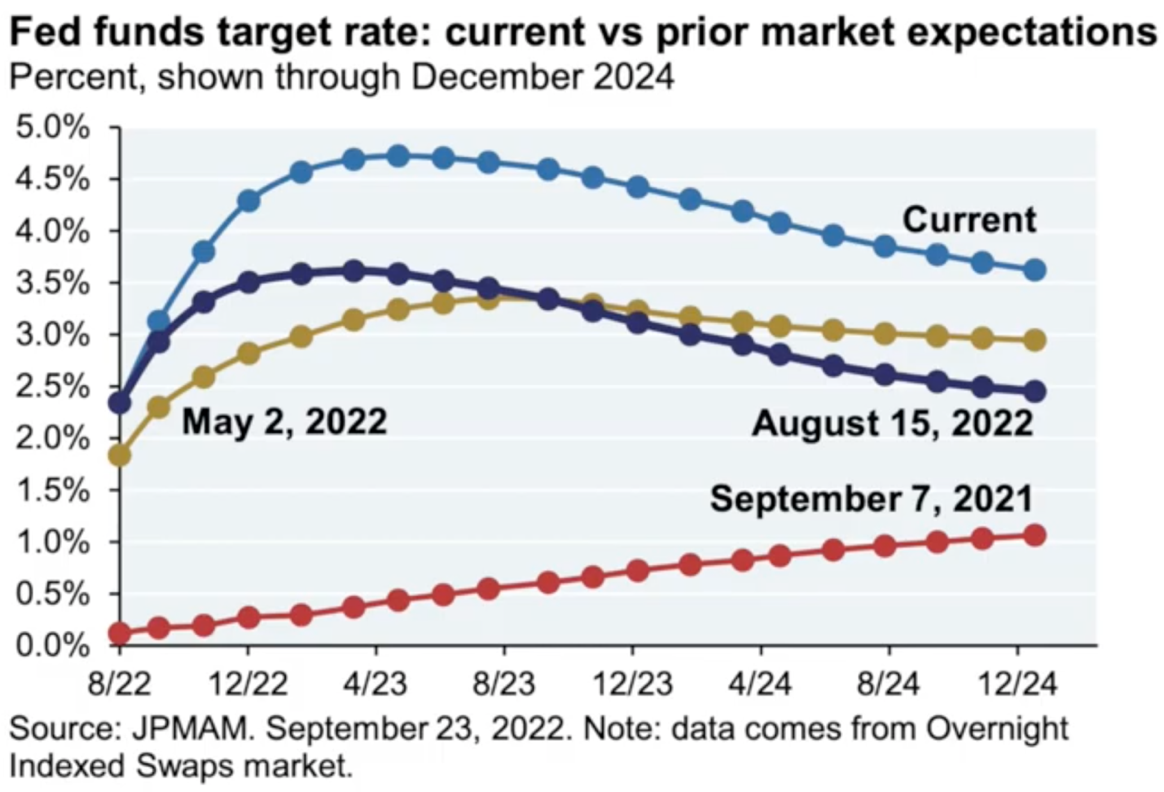
We are glued to this data. In September 2021, the fed funds rate was less than 1%. Today, we are at 3.25%. The markets, based on Federal Reserve announced projections, expect the fed funds rate to peak in April 2023. What is very important to watch is that whenever the expectation curve shifts higher, we are going to see all markets under pressure. Conversely, if the curve shifts lower, we will begin to see relief on rates.
We still need to see a lot of incoming data by way of inflation, employment, and economic numbers to support whether the Fed could slow its rate hikes. The contract signed levels and sales to list ratios will be the leading indicators of the real estate market and what direction it is moving.
As always, please email or call with any questions. We would be happy to have a deeper discussion. Feel free to contact us anytime!