
There’s a lot of information circling around out there about New York City. Should I stay? Should I Go? This is ultimately something people have to decide for themselves and whether or not it’s right for their family. What we do know is that New York City has come back from every crippling blow in the past and we believe that we will survive this one too.
We’re here to help you make those important decisions, by providing you with the facts and figures about what is happening week to week in the New York City real estate market.
Let’s dive into the numbers that you need to know.
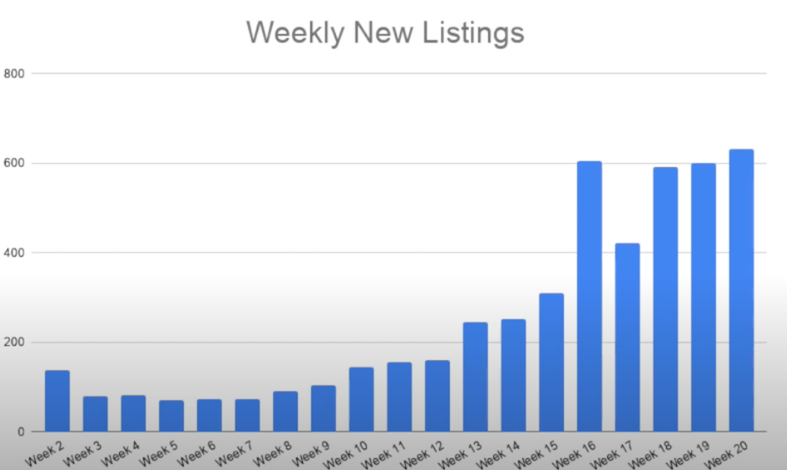
Supply continues to increase
Source: https://www.youtube.com/watch?v=2Gva9ooJrw0
New Listings are up another 600+ for the week ending August 7th. As discussed in our last newsletter, July was a huge month for listings brought to market.
Is there demand for this inventory? It looks that way.
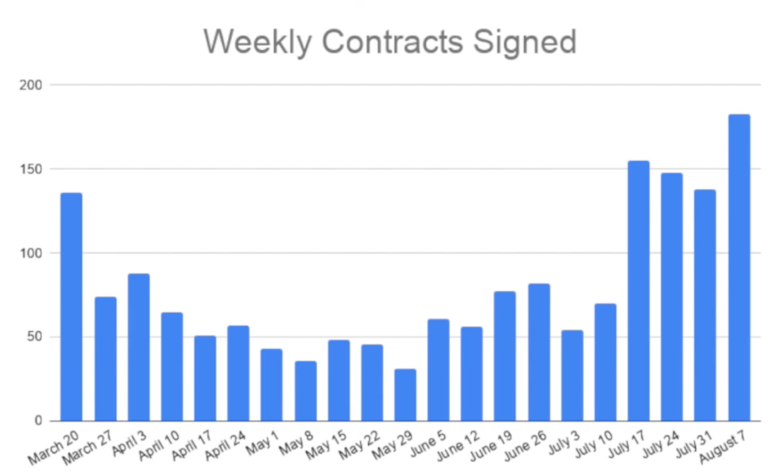
Weekly Contracts Signed
Contracts signed is our best measure on what the real demand is. The market just had its best week since the June 23rd reopening with 183 new contracts signed last week……up 33% from the week before.
https://www.youtube.com/watch?v=2Gva9ooJrw0
Patience is the name of the game here. It takes a while to get deals into contract. The number of contacts signed is a clear indication that the buyers are out and they are getting into deals. Contract activity begets contract activity. Buyers can definitely sniff out when the market is getting better. We are all waiting for an indicator to know if people are out buying or not—this past week has just given us the answer that yes, people are out doing deals.
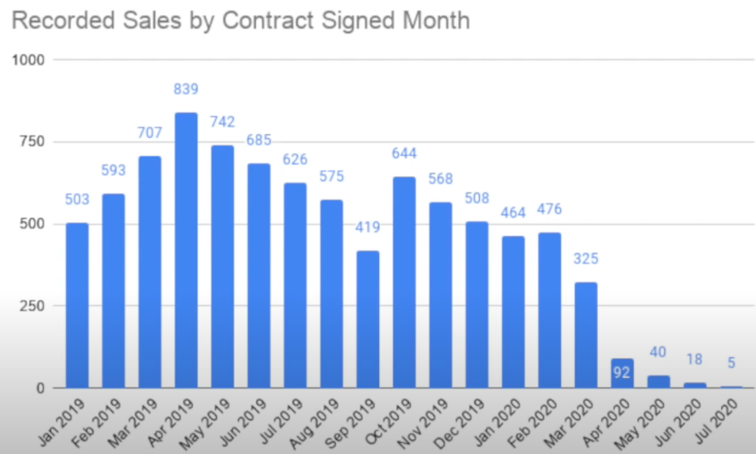
Recorded Sales by Contract Signed Month
https://www.youtube.com/watch?v=2Gva9ooJrw0
The next couple of months is going to prove out the price discovery. The more sales that close the more price visibility will be available. Right now it looks like prices are down in the 10% range. We need the actual sales numbers to prove this out.
As always, if you have any questions feel free to contact us anytime! Please be safe.